We’ve lived through almost 30 years of low inflation so what will a period of significantly higher inflation mean for advice professionals forecasting cash flows for clients?
Low inflation has been a feature of our lives for such a long time we’ve become used to it.
So perhaps it’s not surprising that, when financial advisers think about the long-term rate of inflation in their cash flow assumptions for clients, they often opt for a generally applied rate – usually 2.5% or 3%.
Why? Because the Bank of England has a long-term target inflation rate of 2% for CPI inflation and, given the fact that the retail price index has rarely exceeded 3% in the past 30 years, that seems a reasonable assumption.
That’s true when inflation is low and its effects barely register with clients. But what about when inflationary pressure on spending is rising and people begin to feel the pinch?
In a world where the Office for Budget Responsibility is forecasting CPI inflation peaking at 8.7% at the end of this year, does it make sense to assume that inflation affects all things equally? Or should we be using different inflation rates to reflect spending power? Should we be making different expenditure assumptions for different types of clients? Or at different stages of life?
The case for a ‘personal inflation’ rate
Many of us are beginning to notice the real effect of inflation for the first time in our lives. And the effects of inflation ‘in real life’ don’t always feel like the headline figure we see in the press. How you feel the effects of inflation depends on what you spend your money on.
It’s a point that was made in January by food writer and campaigner, Jack Monroe.
In an influential Twitter thread, Jack argued that rising inflation affected people with lower incomes more than those with higher incomes because of the choices that having a higher income affords.
For instance, the argument runs if – say – an M&S Dine In Deal remains at £10 despite rising inflation, then people who are already able to afford the deal won’t feel the effect of increased prices.
On the other hand, if supermarkets increase the price on everyday items – such as value meals or kitchen cupboard staples like dry pasta and tinned tuna – then people who are least able to afford a rise in prices will feel the effect of those rising prices more.
Jack Monroe’s argument struck home. A week after her tweets, the Office of National Statistics (ONS) announced plans to change its calculation.
And – this week – the ONS has published details of changes to its inflation calculations including plans to develop its Household Cost Indices (HCIs). The HCIs will give an indication of how different households types are being impacted by rising prices based on their spending habits.
Included in its post was a link to its personal inflation calculator which – because it’s based on the Consumer Prices Index combined with owner occupiers’ housing costs – the ONS claims is its ‘most comprehensive measure of consumer prices inflation’ .
The planners dilemma: the basket of goods v the reality of spending
The HCI and personal inflation calculator could prove very useful for planning.
After all, clients could be affected in different ways depending on what they spend their money on and how this changes over time – during retirement, for example.
But the basket of goods used by the Office of National Statistics runs to a total of 720 items and doesn’t reflect what everyone is buying. (As if to illustrate the point, men’s formal jackets and blazers, climbing sessions and meat-free sausages were recently added to the basket – not exactly items with universal appeal.)
Given the sheer variety of items that make up the basket of goods the idea of figuring out a personal inflation rate becomes quite appealing.
The problem is, the confidence with which an adviser can forecast the effect of inflation in retirement is going to depend on establishing some kind of profile of a client’s expenditure.
But how often does an adviser discuss spending in detail? How comfortable would clients be about declaring the kind of things they buy? And would they even feature in ONS’s basket of goods?
And suppose it is discussed, how frequently should the adviser review it with the client, so this information gathering doesn’t feel intrusive or over the top?
But without this kind of insight, it’s hard to tell how inflation affects clients now never mind in the future.
Adapting to a future with inflation
Perhaps the way Jack Monroe deconstructs the headline rate of inflation offers an insight into how to think about forecasting inflationary effects in future.
Because taking examples of what happens in the real world and exploring its consequences for clients can help make the effects of inflation more relatable.
Planners could adopt an approach similar to the attitude to risk applied to investments – low, medium and high – where spending is categorised in a way that reflects the extent to which inflation will influence cash flow.
Distinguishing between the inflationary effects of one type of spending versus another could help planners build a richer picture that will inform their clients’ long-term spending power.
For instance, higher mortgage costs over a sustained period of time, will limit cash-flow for at least the same period of time.
Affordability of long-term care is another example. A friend’s in-law’s residential care home fees have recently increased from £900 to £960 – a rise of almost 7%. That could continue to rise. Who knows? But a 3% forecast won’t adequately account for the weight that this rise brings to bear on the ability to spend elsewhere.
And how many forecasts drawn up in the last decade will have factored in energy bills as having any significant influence on retirement spending even as recently as last year?
Yet UK household energy bills have risen by an average of 54% since April 2021.
So until nuclear and renewable sources displace dependence on fossil fuels in the UK’s energy mix, there’s every reason to think that these bills will remain high for some time.
Within a matter of months, the consequences of inflation will have become a significant feature of life for financial planners and their clients.
It’s sure to affect the complexion of advice for the foreseeable future. For instance, will inflationary increases affect how people choose to take their retirement benefits. Or will inflation-linked annuities become more attractive for those retiring over the next few years?
A financial plan is always an educated guess but – in a world of higher inflation – perhaps one-size-fits all won’t cut it? That’s why it’s important to strike a balance and explain the details around inflation
Underestimating inflation in a cash flow can lead people into a false sense of security but overestimating can make them fearful. It’s important to strike a balance and keep an open dialogue around inflation – reviews are a great time to do this.
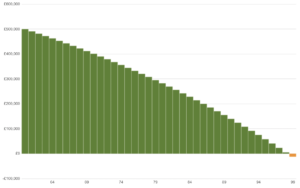
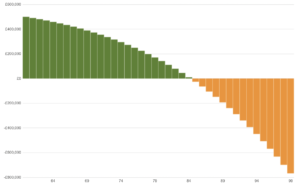
For instance, imagine the cash flow forecast below is for a sixty year old with no income but £500,000 of assets. The assumed rate of return on the assets is 5% per annum with a default inflation rate of 3% per year.
The chart in Figure 1 shows the effect of expenditure of £18,000 and assumes that expenditure increases by the default inflation rate every year. In this scenario they run out of money when they are 98.
In Figure 2 everything remains the same except – this time – their expenditure increases by 6% per annum. They run out of money at 84 – 14 years earlier than the original forecast. Perhaps a cash flow forecast like this could really help clients understand the potential effect of their personal rate of inflation?
Figure 1

Figure 2
